Rubrics in Simulise
Currently, we already offer several rubrics. However, these can also be put together by school.
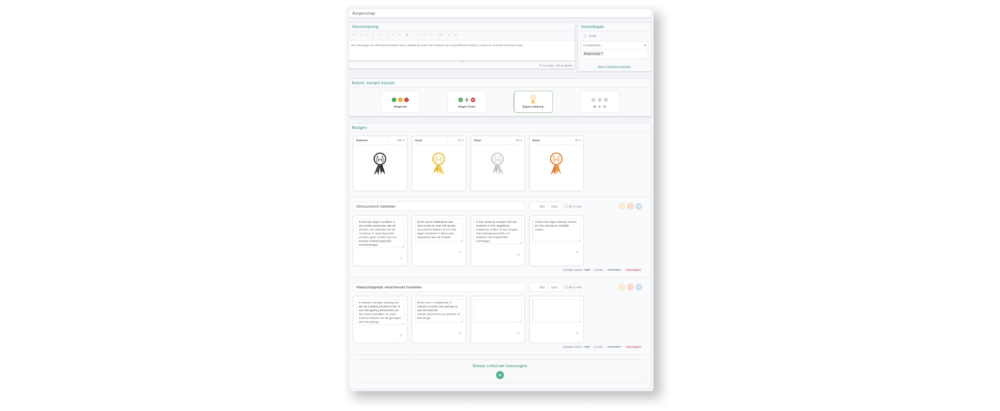
Rubrics can easily be customized and provided with badges or levels. Then you can link them to assignments or learning outcomes. When awarded, they can also be linked to items in the portfolio.
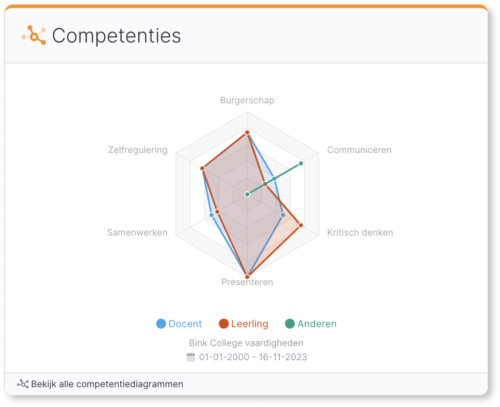
Using rubrics gives you an overall view of skills demonstrated. This is represented in a cobweb diagram.
Thus, developing competencies and skills is given a more prominent role in education. We support students in this process and offer you greater insight in the process.
Own rubrics
Rubrics can be managed centrally and used by teachers in assignments. The completed rubrics result in an overview of skills achieved and developed, in the form of badges.
The most familiar set of broad skills are provided as rubrics in Simulise. You can combine these with assignments. This has enabled reflection on these skills. However, as a school, you can also enter all self-developed rubrics into Simulise. Schools set their own criteria, levels and quantity.

In addition, we also provide the rubrics for Career Orientation and Guidance. This of course includes various LOB assignments.
Create your own rubrics? For that, we offer professional support.
Reflection through rubrics
Each student completes assignments in their own digital portfolio. Collaboration can be done within assignments, such as in the timeline.
When completing an assignment, there are many opportunities for reflection. Your students reflect on their own work through the rubrics, but can also invite others to do so.
By going through the rubrics criteria and determining their level, the first step of assessment is taken. By indicating why they made those choices, reflection takes place.
Normally, both the student and the instructor do this. Want 360-degree feedback in your teaching? Then you can also have different third parties complete the reflection.
Competency charts
Assessment and reflection within Simulise is done on skills or competencies. The overall picture of development is shown with competency diagrams.
These self-created charts are fed from all the various assessments and reflections students have obtained while completing assignments and papers.
A competency diagram shows the student’s development. By maintaining data, this can be done over all the years that the student develops these competencies.


